
Data Analytics
Training & Consultancy
Transforming businesses through data-driven insights and training.
Data Analytics Training
Empowering professionals with essential data skills.
BI Consulting Services
Tailored solutions for your business intelligence needs.
Project Expertise
Industry Experience
About Naoman Daulatabad
Senior Data Analyst & BI Consultant & Trainer I Microsoft Certified Power BI Consultant I Certified SAP Consultant.
I have over 18 years of experience working with top IT firms across various countries. My expertise are in Business Intelligent & Data Analytics projects and Training. I have been involved in more than 10 projects for various clients from Utility, Retail, banking, Entertainment and Manufacturing domains. Also I have trained more than 20,000 IT professionals both online and offline.


25,000+
Total Enrollments
5,000
Hours Taught
4.7/5
Average Rating
Our Courses
Check Out our following courses.
Get Your Dream Data Job
From Basic to Advance – Learn MS Excel from Basic to advance, including AI for Excel, Portfolio Project, Advance Features, Tips & Tricks
MS Excel Essentials
A step-by-step guide to data job opportunities, resumes, interviews, and building a strong digital profile.
Time Intelligent Functions Using DAX in Power BI
From Beginner to Advanced: A Comprehensive Guide to Mastering Time Intelligence Functions in Power BI


From Basics to Advance – Learn Tableau from basics to advanced with practical projects and the latest features.
Tableau Simplified

PL 300 Certification (Power BI) - Practice Test Series
To help clear certification of PL 300. More than 300 questions practice.

Tableau Desktop Specialist
Practice Test Serie
Practice SAP SAC Certification Questions with Explanations to Boost Confidence and Exam Readiness

A Complete Course with Latest Updates – Learn Power BI from basics to advanced with practical projects and the latest features.
Mastering MS Power BI


SAP Analytics Cloud (SAC) Certification Questions Dumps
To help clear certification of TDS. More than 300 questions practice.

From Basic to Advance – Learn Postgre SQL from Basic to advance, including AI with SQL, Basic SQL Topics, Advance SQL Topics, Projects etc.
SQL Essentials

You helped me build confidence in creating interactive dashboards and visualizations.
Olusola Alexander

This course exceeded my expectations. Every section and term is described clearly, just as I hoped. The hands-on projects and clear explanations make learning easy and engaging. Highly recommended for anyone looking to dive deep into Power BI!
Shubham Mate

★★★★★
Initially I was skeptical on how to change my career to data analytics. This course is so well explained that it made me curious and confident to pursue the career in this field.
Deepti

★★★★★

Viet Anh
Clear all basic information as fundamental knowledge to use Power BI in industry. All assignments and quizzes are reasonable and are not time-consuming.
★★★★★
★★★★★
Aneesh K.M.
This course exceeded my expectations. Every section and term is described clearly, just as I hoped. The hands-on projects and clear explanations make learning easy and engaging. Highly recommended for anyone looking to dive deep into Power BI!
★★★★★
Junaid Shaikh
The proficiency of the instructor and the learning resources make learning Tableau a cake walk. Loved the approach and content and would recommend data enthusiasts to enrol.
★★★★★
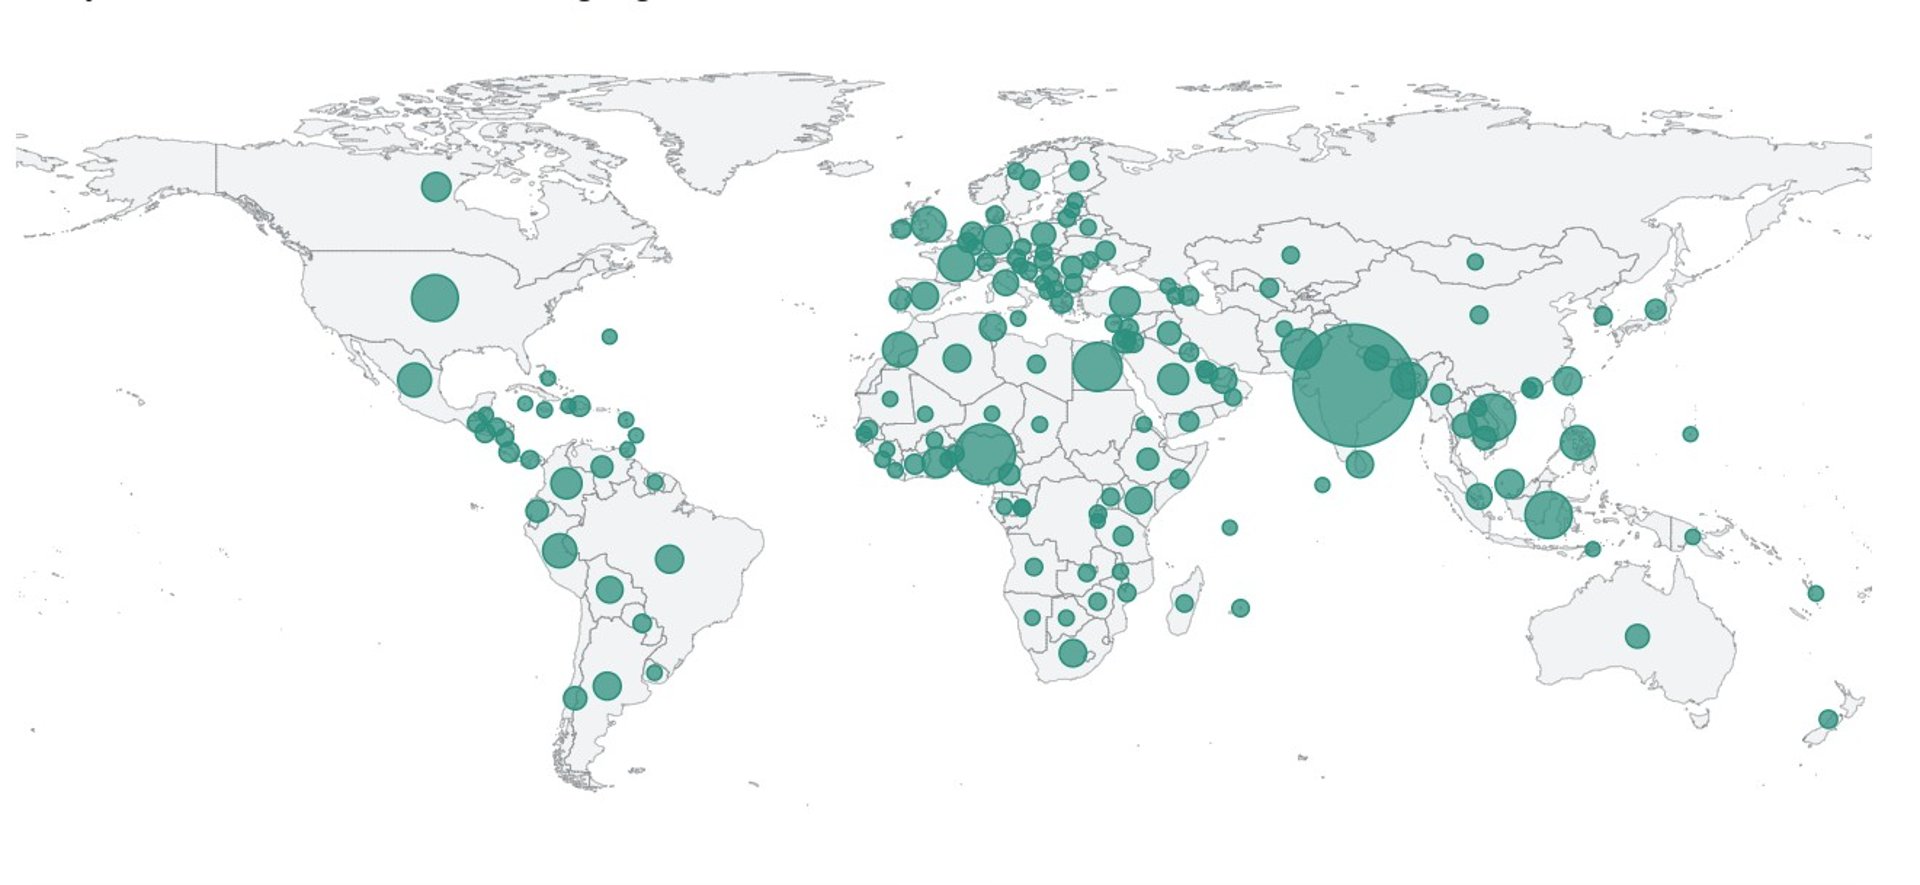
Students' Locations and Languages
Over 20,000 Learners
From 100+ Countries
With 4.7/5 Average Rating
Our Projects
Explore diverse projects across industries showcasing our expertise.


Retail Customer Sales Report
Elite retails wants to create report for the past order details for last four years. Based on the report, Elite retails wants understand their customer and sales to grow more in the future.


Hotel Performance Report
The objective is to develop a comprehensive and user-friendly dashboard for our hotel chain that consolidates key performance metrics, reservation data, financial insights, and customer feedback.


Bank Customer Churn Analysis
In the context of a bank domain project for data analytics, the primary objective is to leverage data to gain valuable insights, improve decision-making processes, enhance operational efficiency, and provide better services to customers.
SQL Data Analysis
Executing Various SQL queries for Data analysis Project